FusionCharts 3D双柱状图
16lz
2021-01-22
1、3D双柱状图页面源码如下
doubleColumn3D.html:
<!DOCTYPE html><!--To change this license header, choose License Headers in Project Properties.To change this template file, choose Tools | Templatesand open the template in the editor.--><html> <head> <title>FusionCharts 3D双柱状图</title> <meta charset="UTF-8"> <meta name="viewport" content="width=device-width"> <script type="text/javascript" src="../script/jquery-1.10.2.js"></script> <script type="text/javascript" src="../script/Charts/FusionCharts.js"></script> <style type="text/css"> body{ width:99%; height:100%; font-size:12px; } #doubleColumn3DChart{ width:100%; } </style> <script type="text/javascript"> $(function(){ var column3D = new FusionCharts( "../script/Charts/MSColumn3D.swf", "myChartId", "100%", "520", "0" ); column3D.setXMLUrl("data/doubleColumn3D.xml"); column3D.render("doubleColumn3DChart"); }); </script> </head> <body> <p id="doubleColumn3DChart"></p> </body></html>2、3D双柱状图数据源
doubleColumn3D.xml:
<?xml version="1.0" encoding="UTF-8"?><chart caption='2012年和2013年统计收入' xAxisName='月份' yAxisName='收入' showValues='0' baseFont='微软雅黑' baseFontSize='14' baseFontColor='#00FF00' outCnvBaseFont='宋体' outCnvBaseFontSize='16' outCnvBaseFontColor='#798777' showAboutMenuItem='1' showLabels='1' labelDisplay='ROTATE ' useEllipsesWhenOverflow='1' rotateLabels='1' slantLabels='1' staggerLines='2' labelStep='3' placeValuesInside='1' showYAxisValues='1' showLimits='1' showpLineValues='1' showShadow='1' adjustp='1' setAdaptiveYMin='1' centerYaxisName='1' useRoundEdges='1' numpLines='8' pLineColor='#987989' pLineIsDashed='1'> <categories> <category label='一月' /> <category label='二月' /> <category label='三月' /> <category label='四月' /> <category label='五月' /> <category label='六月' /> <category label='七月' /> <category label='八月' /> <category label='九月' /> <category label='十月' /> <category label='十一月' /> <category label='十二月' /> </categories> <dataset seriesName='2012'> <set value='45155' /> <set value='12452'/> <set value='63455' /> <set value='45233' /> <set value='95656' /> <set value='87545' /> <set value='12425' /> <set value='94633' /> <set value='85452' /> <set value='75455' /> <set value='32312' /> <set value='65625' /> </dataset> <dataset seriesName='2013'> <set value='65655'/> <set value='74555'/> <set value='61245'/> <set value='12451'/> <set value='95656' /> <set value='24655' /> <set value='45122' /> <set value='32656' /> <set value='65656' /> <set value='95666' /> <set value='65323' /> <set value='54656' /> </dataset></chart>
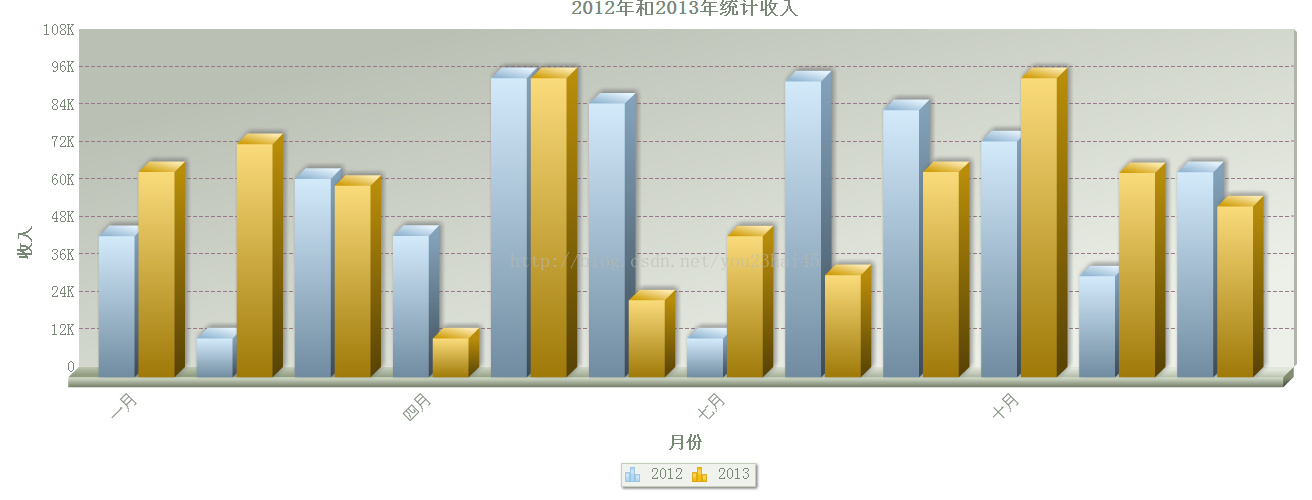
3、运行结果如下图
(1)初始化时
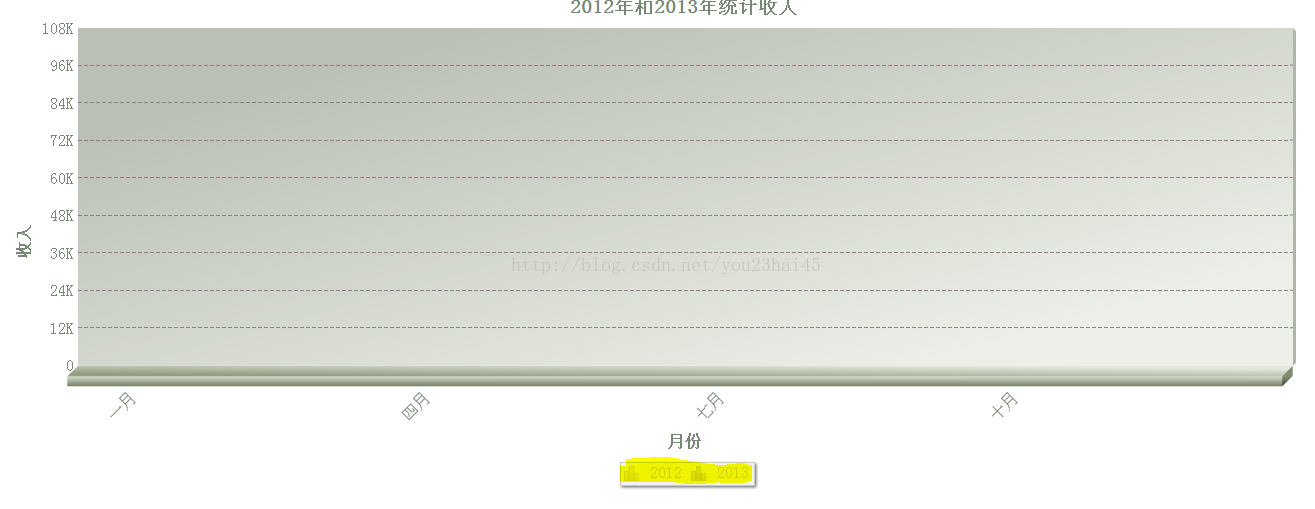
(2)点击图例2012时

(3)点击图例2013时

(4)点击图例2012和图例2013时
以上就是FusionCharts 3D双柱状图的内容,更多相关内容请关注PHP中文网(www.php.cn)!